20
May
USGS Documents Threat of Pesticides to Waterways; Farm Bill Amendment Undermines Clean Water Act
(Beyond Pesticides, May 20, 2013) The U.S. Geological Survey (USGS) released a national assessment that shows the distribution and trends of pesticide use from 1992-2009, providing visible evidence that contamination of pesticides in our nation’s water is clearly a continuing threat. Meanwhile, U.S. Senators are gearing up to put their version of the Farm Bill on the table that would eliminate common sense protections from pesticide applications into our nation’s waterways. These highly controversial amendments would undermine the Clean Water Act and put our health and the environment at risk. Tell your Senators to oppose any efforts to undermine the Clean Water Act.
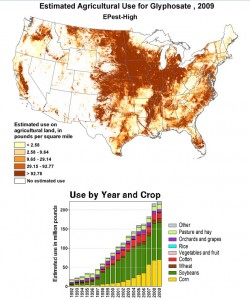
The USGS maps provide, for the first time, a visible depiction of the agricultural use of 459 pesticides for each year during 1992-2009. Maps were created by allocating county-level use estimates to agricultural land within each county. A graph accompanies each map, which shows annual national use by major crop for the mapped pesticide for each year during the period. These pesticide use estimates are suitable for evaluating national and regional patterns and trends of annual pesticide use.
 To see the maps, go to USGS’s Pesticide National Synthesis Project Page and click on a pesticide. The map not only shows you how many pounds per square miles were used for each year, but also includes details about which crops they were used on. Glyphosate (pictured right) shows an increase of over 100 lbs from 2001 to 2009.
Pesticide use estimates from USGS’s study help provide national, regional, and watershed assessments of annual pesticide use, however the agency points out that reliability of estimates generally decreases with scale. For example, detailed interpretation of use intensity distribution within a county cannot be gleaned from the maps. Although county-level estimates were used to create the maps and are provided in the data set, surveyed pesticide-by-crop use was not available for all crop reporting districts (CRDs) and, therefore, extrapolation methods were used to estimate pesticide use for some counties. Also, surveyed pesticide-by-crop use may not reflect all agricultural use on all crops grown. With these caveats in mind, the maps, graphs, and associated county-level use data are critical data for water-quality models and provide a comprehensive graphical overview of the geographic distribution and trends in agricultural use in the conterminous United States.
Waterways in the U.S. are increasingly imperiled from various agents, including agricultural and industrial discharges, nutrient loading (nitrogen and phosphorus), and biological agents such as pathogens. Pesticides discharged into our nation’s rivers, lakes and streams can harm or kill fish and amphibians. These toxicants have the potential to accumulate in the fish we eat and the water we drink. The spirit of the Clean Water Act is that every community in the United States has the right to enjoy fishable and swimmable bodies of water. These regulations are currently under attack in Farm Bill amendments that would strip away critical protections from our nation’s rivers, lakes, and streams. Without the Clean Water Act, there are no common sense backstops requiring applicators to at least consider alternatives to spraying toxic pesticides directly into waterways.
Act Now! We can’t afford to lose these protections. Tell your Senators to oppose any efforts to undermine the Clean Water Act.
For more information, read our factsheet, Clearing up the Confusion Surrounding the New NPDES General Permit and visit our Threatened Waters page. To keep up to date on Congressional and government agency actions, sign-up for Beyond Pesticides’ action alerts


